I'm back at work from an extended break only to find that my favourite statistics portal OFFSTATS is no more :-( https://www.library.auckland.ac.nz/about-us/collections/decommissioned-databases
I received an email from them explaining that they no longer have the resourcing available to maintain and develop the database. Also, as much of the content can now be discovered through other approaches they felt the need for this type of search tool was not so relevant as it had been a few years ago.
A shame but understandable from their point of view. It was always a popular resource on my search workshops and often featured in the participants' "Top Ten Tips". It was one of the few resources of this type in which humans assessed and monitored the quality and relevance of the sites listed. Very sorry to see it go.
Showing posts with label Statistics. Show all posts
Showing posts with label Statistics. Show all posts
Wednesday, 16 August 2017

Friday, 14 February 2014
Business information key resources
On one of my recent workshops I was asked if I used Google as my default search tool, especially when conducting business research. The short answer is "It depends". The long answer is that it depends on the topic and type of information I am looking for. Yes, I do use Google a lot but if I need to make sure that I have covered as many sources as possible I also use Google alternatives such as Bing, Millionshort, Blekko etc. On the other hand and depending on the type of information I require I may ignore Google and its ilk altogether and go straight to one or more of the specialist websites and databases.
Here are just a few of the free and pay-per-view resources that I use.
Information on industry sectors
My favourite collection of guides on industry sectors is The British Library Business Information and IP Centre’s industry guides. These highlight relevant industry directories, databases, publications and web sites and are excellent starting points if you are new to a sector
Statistics
There are at least a dozen statistics sites that I use on a regular basis but if I'm unsure of where to look or want to make sure I haven't missed anything I use OFFSTATS – Official Statistics on the Web at http://www.offstats.auckland.ac.nz. A great starting point for official statistical sources by country, region subject or a combination of categories. All of the content in the database is in the public domain and available through the Internet and has been quality assessed by staff at The University of Auckland Library.
Official company information
If I want to confirm the existence of a company or obtain filings and accounts I usually go direct to the relevant official company registry. I have a list of the registries that can be searched online at http://www.rba.co.uk/sources/registers.htm. As many of my enquiries are for UK companies I am a frequent visitor to Companies House at http://www.companieshouse.gov.uk/. Some information is free but filings and accounts are priced. There are several companies that repackage Companies House data and sometimes make extra data or analysis free of charge for example Company Check at http://www.companycheck.co.uk/, which enables you to search by company or director's name. Risk reports, information on CCJs, and some official filings are priced if you do not have a subscription to the full service.
Share price information
For free share price information I use Yahoo Finance (http://uk.finance.yahoo.com/) and Google Finance (https://www.google.co.uk/finance). Both of these services provide charts and news on shares on the major stock markets. Google's graphs are ‘annotated’ with labels that link to news articles listed to the right of the graph, so you can see whether or not a particular event or announcement has affected a share price. Both offer free, daily historical share prices in figures. As well viewing historical graphs for share prices you can download the data as a spreadsheet.
News alerts
For news alerts I use a mixture of bookmarked searches, Google email and RSS alerts, and RSS feeds from a wide range of blogs and news sites. I find that Google alerts are erratic and unreliable but they do sometimes pick up something unique so I still include them in the mix. RSS feeds are my main source of current awareness and when a news feed is rather broad in coverage I use my RSS reader's search function to identify the articles that are of interest to me. I use a desktop reader call RSSOwl (http://www.rssowl.org/) but Inoreader (http://inoreader.com/) is a web based service that offers similar features and options.
Who is behind a site?
If I am to use any information from the web for business purposes I need to know who is behind the website. DomainTools http://www.domaintools.com/ is one of many services that will tell who owns a domain name, unless they are hiding behind an agent or privacy protection service. There is also a Whois+ extension for Chrome (my default browser) that can be used to run a quick and easy check on the domain name of a displayed page.
Monday, 7 October 2013
Interactive maps of UK renewable energy generation
I recently mentioned Gridwatch (How the UK’s electricity is generated as a way of tracking how much energy is passing through the National Grid and the technology used to generate that electricity. Although Gridwatch is a great way of observing the total amount of electricity that is generated by each technology - gas, coal, wind etc - it does not go into any detail with respect to individual installations. The Digest of UK energy statistics (DUKES) produced by the UK Department of Energy & Climate Change (http://www.gov.uk/government/organisations/department-of-energy-climate-change/series/digest-of-uk-energy-statistics-dukes) includes a spreadsheet listing all of the operational power stations, fuel that they use, installed capacity, location, and the year that generation began. The direct link to the spreadsheet is http://www.gov.uk/government/uploads/system/uploads/attachment_data/file/226895/dukes5_11.xls. This is historical data and the current list refers to plants in operation at the end of May 2013.
UK Energy Watch has a map (http://www.ukenergywatch.org/Electricity/PowerStations) showing the location of UK power stations of 400 MW or larger, so it is by no means comprehensive. It does allow you, though, to click on a plant and display current generation except for CCGT stations (Combined Cycle Gas Turbine).
There are more options available when it comes to what are called renewables (for example wind, solar, biomass, hydro). The DECC's RESTATS interactive map at http://restats.decc.gov.uk/app/pub/map/map/ enables you to search by technology, region, county, planning authority and application status. It also has a separate map for wind farm capacities.

The site information includes installed capacity, details of the planning application but not how much energy is actually being produced. RESTATS says that "Information is held on the performance of operational projects but owing to the need to maintain the commercially sensitive nature of these data, specific site details and performance figures are not disclosed".

The UK Data explorer has produced a renewables map at http://ukdataexplorer.com/renewables/ that uses the RESTATS data and shows operational renewable electricity sites over 0.01 MW. The different colours represent the type of plant and the area of the circles indicate installed capacity (maximum power output).

To see details of a specific installation you should be able to hover over a point on the map. This did not work for me with some of the smaller plants and when I tried to zoom in on an area I often lost the background map.
The Interactive Map of Renewable and Alternative Energy Projects in the UK at http://www.renewables-map.co.uk is another interactive map and can be filtered by technology type and planning status.

According to the website the information is gathered from "a wide range of web resources, in all cases these will be referenced, usually by a link to that information. Locations are either taken from existing data, usually from planning applications, or by painstakingly identifying the location on the ground using online maps." I am not sure how up to date the map is and I noticed that the smaller hydro installations along the Thames are missing. Another problem that I have experienced with this site is that when I click on "More details" for an installation I get far too many "internal sever errors". However, when the information does appear it includes useful comments on the technology, links to relevant websites and the latest news.

The final one in my list is from the energy generating company RWE Innogy (http://www.rwe.com/web/cms/en/194914/rwe-innogy/sites/production-data-live/). Its interactive map provides information on most of its European plants and includes wind farms, hydro power plants and biomass CHP (Combined Heat and Power). The production data is updated every minute. To see information on an installation, click on its icon on the map. The information includes live production, location, type of installation and when production started.

These are by no means the only websites offering interactive maps and information on UK energy production, and none of them give the full picture. They are good starting points, though, if you are interested in researching individual technologies or individual power stations.
Sunday, 28 July 2013
Statista: statistics, industry and market data
Statista (http://www.statista.com/) is a portal for statistics, market data, market research and survey results. It aggregates data on over 600 international industries from more than 18,000 sources, including market researchers, trade organizations, scientific journals, and government databases. You can get a rough idea of what the service covers from the list of topics at http://www.statista.com/topics/, although this does give the impression that it is heavily US biased, which is not the case.
Searching Statista is straightforward. The default is to include what it calls word fragments, so a search on the term bank will also find banking. This can be changed to identical words if you require an exact match. To search for phrases place double quote marks around your terms, and documents containing a specific term can be excluded by prefixing the word with an exclamation mark. You can 'OR' terms by inserting the vertical bar symbol (|) between them, for example dog | cat. To refine your search further use the options on the right hand side of the results page. These include date of publication, region, free/fee-based/all, and category.
Trying to view the data and charts that you find can be a frustrating process as most of the information is only available on subscription. There is a limited amount of free information but you still have to register for what Statista calls its basic free access. The premium account for an individual user is USD 49/month and runs for a minimum of 12 months. This is automatically renewed so make sure you cancel before the year is up if you no longer wish to use it. The corporate subscription is USD 199.90/month. Again the subscription runs for 12 months. A free trial is available for the corporate service but not for individual users. Prices for universities, libraries and education are available on request.
On the results page you can easily identify the subscription content by the red plus sign next to the chart icon to the left of the result. A red 'P' indicates a priced report that is free to corporate clients but can be purchased by basic and premium account holders.

Clicking on a result takes you to a page where the data is displayed as a chart or graph depending on what Statista thinks is the most appropriate for that statistic, but you can change the representation if you wish. There are also options for downloading the data in various formats and links to the original source.

Information is provided on the source and includes title of the original document, the publisher, publication date, time period covered by the survey and the geographical regions covered. Statista also adds notes such as definitions of terms used in the original report and observations on possible missing data.

Much of the information on Statista can be found by via Google or Bing using advanced search commands and options, but you will probably have to wade through a significant amount of irrelevant information before you find the data you need. Statista can certainly save you a considerable amount of time, and the data displays are a great way of helping you identify the potential usefulness of a report, as can the metadata and notes.
Is the subscription worth it? It is definitely cost effective for corporates in terms of saving search time and ensuring accuracy and quality of information. I have had good feedback about Statista from several of my clients. I am not so sure about individual users. Some of my own research is highly specialised and I am not convinced that Statista covers all of the areas of interest to me. It is difficult for me to assess its value without trialing the full service first, and there are no pay as you go options such as a day or weekly rate. I might even consider paying for a month's access for a project but it is a full year's subscription or nothing. Nevertheless, I recommend you take a serious look at it and if you are contemplating a corporate subscription you can ask for a free trial. It is now on my list of essential research tools.
Friday, 12 July 2013
Top Tips from SWAMP

The session was organised for the libraries of the wonderfully named SWAMP - South West and Mid Wales Partnership.
We had fantastic views from the library of the sea and shore line so they did very well to remain focused on the work in hand. The top tips that the group suggested at the end of the day were a mixture of search techniques and business information sites.
1. Persistence.
Don't give up and don't get stuck in a rut. If your first attempts fail to produce anything useful try a different approach to your search. Try some of the tips mentioned below: use advanced search commands, a different search tool or go direct to a website that covers your subject area or type of information.
Don't give up and don't get stuck in a rut. If your first attempts fail to produce anything useful try a different approach to your search. Try some of the tips mentioned below: use advanced search commands, a different search tool or go direct to a website that covers your subject area or type of information.
2. Verbatim.
Google automatically looks for variations on your search terms and sometimes drops terms from your search without telling or asking you. To beat Google into submission and make it run your search exactly as you have typed it in, click on ‘Search tools’ in the menu above your results, then click on the arrow next to ‘All results’ and from the drop down menu select Verbatim.
Google automatically looks for variations on your search terms and sometimes drops terms from your search without telling or asking you. To beat Google into submission and make it run your search exactly as you have typed it in, click on ‘Search tools’ in the menu above your results, then click on the arrow next to ‘All results’ and from the drop down menu select Verbatim.
3. Private Browsing.
To stop search engines personalising your results according to your previous searches and browsing behaviour, find out where the private browsing option is in your browser (in Chrome it is called Incognito). This ignores all cookies and past search history and is as close as you can get to unfiltered results.
To stop search engines personalising your results according to your previous searches and browsing behaviour, find out where the private browsing option is in your browser (in Chrome it is called Incognito). This ignores all cookies and past search history and is as close as you can get to unfiltered results.
Short cuts to private browsing in the main browsers are:
Chrome - Ctrl+Shift+N
FireFox - Ctrl+Shift+P
Internet Explorer - Ctrl+Shift+P
Opera - Ctrl+Shift+N
Safari – click on Safari next to the Apple symbol in the menu bar, select Private Browsing and then click on OK.
4. The site: command.
Include the site: command in your search to focus your search on particular types of site, for example site:ac.uk, or to search inside a large rambling site. You can also use -site: to exclude sites from your search. For example, if you are searching for information on Wales and Australian websites mentioning New South Wales keep coming up include -site:au in your search.
Include the site: command in your search to focus your search on particular types of site, for example site:ac.uk, or to search inside a large rambling site. You can also use -site: to exclude sites from your search. For example, if you are searching for information on Wales and Australian websites mentioning New South Wales keep coming up include -site:au in your search.
5. The filetype: command.
Use the filetype: command to limit your research to PowerPoint for presentations, spreadsheets for data and statistics or PDF for research papers and industry/government reports. Note that in Google filetype:ppt and filetype:xls will not pick up the newer .pptx and xlsx formats so you will need to incorporate both into your strategy, for example filetype:ppt OR filetype:pptx, or run separate searches for each one. In Bing.com, though, filetype:pptx will pick up both .ppt and .pptx files.
Use the filetype: command to limit your research to PowerPoint for presentations, spreadsheets for data and statistics or PDF for research papers and industry/government reports. Note that in Google filetype:ppt and filetype:xls will not pick up the newer .pptx and xlsx formats so you will need to incorporate both into your strategy, for example filetype:ppt OR filetype:pptx, or run separate searches for each one. In Bing.com, though, filetype:pptx will pick up both .ppt and .pptx files.
6. Guardian Data Store (http://www.guardian.co.uk/data/)
For datasets and visualisations relating to stories in the news. This is proving to be a very popular site on both the public and in-house workshops. As well as the graphs and interactive maps the source of the data is always given and there are links to the original datasets that are used in the articles.
For datasets and visualisations relating to stories in the news. This is proving to be a very popular site on both the public and in-house workshops. As well as the graphs and interactive maps the source of the data is always given and there are links to the original datasets that are used in the articles.
7. Company Check (http://www.companycheck.co.uk/)
Company Check repackages Companies House data and provides 5 years of figures and graphs for Cash at Bank, Net Worth, Total Liabilities and Total Current Liabilities free of charge. It also lists the directors of a company. Click on a director’s name and you can view other current and past directorships for that person.
Company Check repackages Companies House data and provides 5 years of figures and graphs for Cash at Bank, Net Worth, Total Liabilities and Total Current Liabilities free of charge. It also lists the directors of a company. Click on a director’s name and you can view other current and past directorships for that person.
8. BL BIPC industry GuidesThe British Library Business Information and IP Centre’s industry guides at http://www.bl.uk/bipc/dbandpubs/Industry%20guides/industry.html highlight relevant industry directories, databases, publications and web sites. Excellent starting points if you are new to the sector.
9. Web archives for documents, pages and sites that are no longer "live".
Most people know about the Internet Archive's Wayback Machine at http://www.archive.org/and its collection of snapshots of websites taken over the years. There is also a collection of old UK government webpages at http://www.nationalarchives.gov.uk/webarchive/, and the British Library has a UK web archive at http://www.webarchive.org.uk/ukwa/.
Most people know about the Internet Archive's Wayback Machine at http://www.archive.org/and its collection of snapshots of websites taken over the years. There is also a collection of old UK government webpages at http://www.nationalarchives.gov.uk/webarchive/, and the British Library has a UK web archive at http://www.webarchive.org.uk/ukwa/.
10. Keep up to dateKeep up to date with what the search engines are up to, changes to key resources and new sites. Identify blogs and commentators that are relevant to your research interests and subject areas and follow them using RSS or email alerts.
Friday, 25 January 2013
Zanran - great for data in tables, charts and graphs
I regularly mention Zanran (http://www.zanran.com/) in my workshops on search and business information, and it often finds its way into the Top Tips compiled by the delegates at the end of the day.


Zanran is not a Google alternative. Rather than search the text of web pages it extracts and indexes numerical data presented as tables, charts and images in PDF reports, spreadsheets and ordinary web pages. You can simply type in your search terms but there are additional options for narrowing down the search by location of the web server, specifying an individual site, selecting a time period and limiting by file type.
The results page lists the files it has found with an extract highlighting the content containing your terms. In this example I am looking for data on agricultural methane emissions in the UK.

To the left of each entry is a thumbnail. Moving the cursor over the thumbnail brings up a preview of the page containing the relevant chart, table or image. This enables you to immediately assess the relevance of the data without having to download and go through a lengthy document.

If you click on the thumbnail or the title to view the whole document you have to register (free of charge) as copies of the indexed documents are stored by Zanran. If you prefer to go to the original document click on the URL button attached to the summary of the page and click on the link that is then revealed. Unfortunately, you may see “page not found” especially if it is on a UK government department web site. Many of these have now been closed and their content archived making it difficult to track them down. Registering with Zanran is by far the easier option. Also, rather than deluge you with documents from a single site, as Google all too often does, Zanran gives you a link telling you if and how many other results are available on a site.
How does it compare with Google? Well, Google did come up with relevant results for my search but I had to spend a lot of time ploughing through them to identify the best documents. And Google did not pull up in the first 100 results the very useful archived UK government documents that Zanran gave me.
If you are looking for data or statistics Google still does a very good job but I recommend you also run a search in Zanran. It may well come up with a real gem, as it often has for me.
Tuesday, 8 January 2013
EU launches public beta of its open data portal
The EU has launched a public beta of its new open data portal at http://open-data.europa.eu/open-data/. Open data is information that can be freely used, re-used and redistributed by anyone. The EU portal covers all the information that public bodies in the European Union produce, collect or pay for. At present it has 5,811 datasets of which 5,634 come from Eurostat, the statistical office of the EU.
You can search the datasets by keyword and refine your results using the keywords and publishers listed on the right of the screen.

Alternatively there are options for browsing the datasets using tags and keywords. This may be easier if you are not sure of what terms to use.

Using the tags also seems to be more reliable. A search on coal production gave me one relevant dataset but the rest of the results only had production as a keyword. I was seeing sets for carrot production, production of butter, sunflower production etc. I assume that 'coal' had been dropped because there were so few results containing both terms. Searching on just coal reduced the number of results from around 5000 to 7, one of which was highly relevant (Primary production of coal and lignite). The other 6 covered energy production in general including coal. Browsing and narrowing down the sets using the tags does seem to be the best way of navigating the data at the moment.
Once you have identified a relevant dataset additional information such as time span and date last modified are provided together with links for downloading the data.
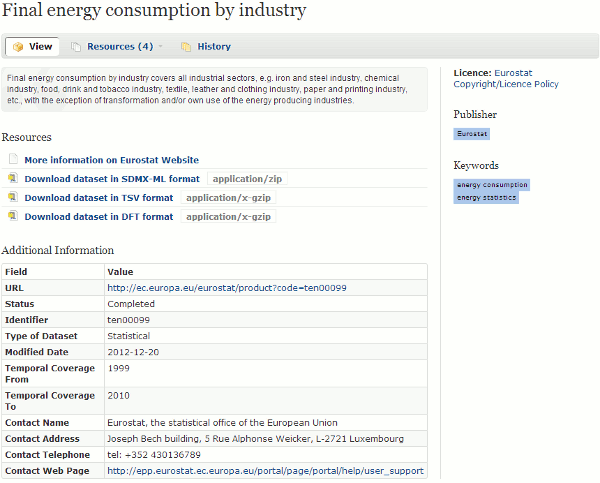
It's then up to you to find a way of viewing and analysing the data!
Monday, 26 November 2012
New StatsWales to be launched
StatsWales is the key website to visit for statistics on Wales. A new version of the site, StatsWales 'Beta', has been launched with a full launch planned for Monday 3rd December.
New features include:
- improved search capability
- enhanced charting
- direct URI access to data catalogue and reports
- better sharing of reports including those personally tailored/configured
- additional direct data access formats
- more powerful personalisation
- support for legacy links
While data is being transferred to the new system access to both the new and the old services will be provided as follows:
https://statswales.wales.gov.uk - will link to the new system
http://statswales1.wales.gov.uk - link to the old StatsWales system will work until 31st December
http://statswales.wales.gov.uk - will point to the actual current system in use during this transition period
http://statswales1.wales.gov.uk - link to the old StatsWales system will work until 31st December
http://statswales.wales.gov.uk - will point to the actual current system in use during this transition period
A video tutorial on the new system is available at https://www.youtube.com/watch?v=a08s26rDM1g
Saturday, 24 September 2011
Public Data Explorer survives Google Labs
Public Data Explorer has escaped the cull at Google Labs, from which it has now "graduated". There were signs that it might survive when Google started adding public data charts to the top of the results for some statistics searches. It can now be found at http://www.google.com/publicdata/. Public Data Explorer allows you to search and compare sets of public data such as population, energy consumption, mobile phone usage and government debt across countries. You can select the countries or states that you wish to compare and view the data as line graphs, bar charts, map visualizations or bubble charts.

Data sets include information from the OECD, World Bank, Eurostat and various US government departments. There is also an option to upload your own data sets - details are at http://www.google.com/publicdata/admin. This probably accounts for some of the very specific data that is now available, for example: Australian Population Estimates, Unemployment rate Italy and Catalan municipalities indicators. The full list is at http://www.google.com/publicdata/directory. It is worth exploring the more generic titles such as "World Bank, World Development Indicators" and "OECD Factbook 2010" to uncover the full range of what is available.
Wednesday, 10 November 2010
StatsWales: free statistics on Wales
When looking for UK official statistics many of us immediately think of http://www.statistics.gov.uk/. If you are looking for data on Wales, though, you really should be heading for the Welsh Assembly's StatsWales at http://statswales.wales.gov.uk/. This is a free-to-use service that allows you to "view, manipulate, create and download tables from the most detailed official data on Wales". You can run a keyword search on the data or simply browse the Reports folders.

The built in search option may be your best bet (Note: Google 'site:' search does not work on this data collection). Most of the tables, charts and reports are clearly labelled but there are some sections where all you are told is that the data is "Indicator 9a" or "Indicator 12c", for example. It is only when you click on the file that you discover it's contents.


There are many options for viewing and manipulating the data on the web site itself and it can seem overwhelming at times. You may prefer to just download the data sets and work on them offline, but if you think you might be a regular user of the this site it is worth working through the tutorials and getting to grips with the StatsWales tools. You can register for e-mail notifications of changes to specific datasets and RSS feeds are also available to alert you to new sets that have been added to the site.

The built in search option may be your best bet (Note: Google 'site:' search does not work on this data collection). Most of the tables, charts and reports are clearly labelled but there are some sections where all you are told is that the data is "Indicator 9a" or "Indicator 12c", for example. It is only when you click on the file that you discover it's contents.

You can also select subsets of the data and produce your own tables and charts. If you register you can create your own profile, design and save your reports.

There are many options for viewing and manipulating the data on the web site itself and it can seem overwhelming at times. You may prefer to just download the data sets and work on them offline, but if you think you might be a regular user of the this site it is worth working through the tutorials and getting to grips with the StatsWales tools. You can register for e-mail notifications of changes to specific datasets and RSS feeds are also available to alert you to new sets that have been added to the site.
Tuesday, 20 April 2010
Volcano watching
For those of us with friends and families stranded away from home because of "that volcano" in Iceland, and those who had been planning to travel through Europe in the next few days, volcano watching has become a way of life. There is a myriad of resources providing information on volcanoes in general, the progress of ash clouds, and links to live volcano web cams including Eyjafjallajökull - the current villain of the piece.
Let's start with the web cams. Volcano Web Cams - John Seach http://www.volcanolive.com/volcanocams.html has links to some of them including Eyjafjallajökull (http://eldgos.mila.is/eyjafjallajokull-fra-valahnjuk/). At the time of writing, though, the servers linking the three web cams covering Iceland's bête noire to the rest of the world appear to have been overloaded with traffic and are rejecting connections. A list of US volcano web cams is on the US Geological Survey web site at Volcano Hazards Program Webcams http://volcanoes.usgs.gov/images/webcams.php. For volcanoes elsewhere, Volcano WebCams around the Pacific Ring of Fire and Beyond is at http://www.skimountaineer.com/ROF/VolcanoWebCams.php.
General information and data on US volcanoes is available via the USGS at http://volcanoes.usgs.gov/vhp/observatories.php. If you are worried about supervolcano Jellystone - sorry, Yellowstone - going up, that has its own observatory at http://volcanoes.usgs.gov/yvo. For volcanoes worldwide there is a comprehensive list at the Smithsonian Institution Global Volcanism Program (http://www.volcano.si.edu/) that you can download in Excel format. The list is is also available on the Guardian datablog at "Volcanic ash: how do you spot the next volcano to disrupt flights?" http://www.guardian.co.uk/news/datablog/2010/apr/20/volcanic-ash-smithsonian-icao. In addition The Guardian article includes the ICAO map (International Civil Aviation Organization) that shows how flight routes cross volcanic risks.
The London Volcanic Ash Advisory Centre at the UK Met Office issues updated graphics of the ash cloud at http://www.metoffice.gov.uk/aviation/vaac/vaacuk_vag.html.

The Guardian news blog has updated daily blog postings of all news concerning the volcano and its impact on travel. Today's posting is at http://www.guardian.co.uk/world/blog/2010/apr/20/iceland-volcano-ash-flights-eruption.
And finally, there are some spectacular and beautiful photographs at "More from Eyjafjallajokull" http://www.boston.com/bigpicture/2010/04/more_from_eyjafjallajokull.html
Let's start with the web cams. Volcano Web Cams - John Seach http://www.volcanolive.com/volcanocams.html has links to some of them including Eyjafjallajökull (http://eldgos.mila.is/eyjafjallajokull-fra-valahnjuk/). At the time of writing, though, the servers linking the three web cams covering Iceland's bête noire to the rest of the world appear to have been overloaded with traffic and are rejecting connections. A list of US volcano web cams is on the US Geological Survey web site at Volcano Hazards Program Webcams http://volcanoes.usgs.gov/images/webcams.php. For volcanoes elsewhere, Volcano WebCams around the Pacific Ring of Fire and Beyond is at http://www.skimountaineer.com/ROF/VolcanoWebCams.php.
General information and data on US volcanoes is available via the USGS at http://volcanoes.usgs.gov/vhp/observatories.php. If you are worried about supervolcano Jellystone - sorry, Yellowstone - going up, that has its own observatory at http://volcanoes.usgs.gov/yvo. For volcanoes worldwide there is a comprehensive list at the Smithsonian Institution Global Volcanism Program (http://www.volcano.si.edu/) that you can download in Excel format. The list is is also available on the Guardian datablog at "Volcanic ash: how do you spot the next volcano to disrupt flights?" http://www.guardian.co.uk/news/datablog/2010/apr/20/volcanic-ash-smithsonian-icao. In addition The Guardian article includes the ICAO map (International Civil Aviation Organization) that shows how flight routes cross volcanic risks.
The London Volcanic Ash Advisory Centre at the UK Met Office issues updated graphics of the ash cloud at http://www.metoffice.gov.uk/aviation/vaac/vaacuk_vag.html.

The Guardian news blog has updated daily blog postings of all news concerning the volcano and its impact on travel. Today's posting is at http://www.guardian.co.uk/world/blog/2010/apr/20/iceland-volcano-ash-flights-eruption.
And finally, there are some spectacular and beautiful photographs at "More from Eyjafjallajokull" http://www.boston.com/bigpicture/2010/04/more_from_eyjafjallajokull.html
Tuesday, 6 April 2010
Internet Statistics: BBC SuperPower - Visualising the internet
Looking for some interesting stats about the web? Then head straight for this section on the BBC web site (http://news.bbc.co.uk/1/hi/technology/8552415.stm), which is part of SuperPower, a season of programmes exploring the power of the internet. It provides a range of statistics including interactive graphics showing the most visited sites and types of site on the internet (as measured by Nielsen). The top 100 sites graphic breaks down into search/portals, social networks, retail sites, media/news and by country. Move your cursor over a block in the visualistaion and it will display the name of the site, number of unique visitors and percentage market share.
The Web Rich List holds no surprises with Larry Page and Sergey Brin at the top and both worth 17.5 billion USD. The Net Growth map has a slider bar underneath it that you can use to view internet usage over time. Set the slider bar at the year you are interested in, move your cursor over a country and it will tell you the number of users.

The Web Rich List holds no surprises with Larry Page and Sergey Brin at the top and both worth 17.5 billion USD. The Net Growth map has a slider bar underneath it that you can use to view internet usage over time. Set the slider bar at the year you are interested in, move your cursor over a country and it will tell you the number of users.

'How it Works' has a very basic set of slides about how the Internet works but you might find the counters to the right of the slides more interesting. They claim to show the estimated number of internet users in the world, the number of email messages posted so far today (includes spam), the number of blog posts today, and the approximate number of Google searches today. An obvious number that is missing is the number of Tweets but you can find some statistics on Twitter's own blog at Twitter Blog: Measuring Tweets http://blog.twitter.com/2010/02/measuring-tweets.html
Saturday, 27 March 2010
Google Public Data Explorer- fine as far as it goes
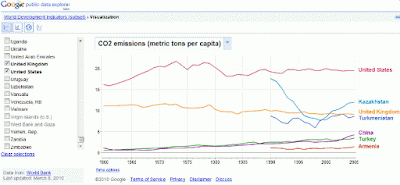
Currently a Google Labs project, the Public Data explorer (http://www.google.com/publicdata/home) "makes large datasets easy to explore, visualize and communicate. As the charts and maps animate over time, the changes in the world become easier to understand." The example given on the home page is a chart showing data from the World Bank on fertility rates per woman by country and life expectancy at birth. At first glance you may be deterred by what appears to be limited datasets but there are options to explore by selecting countries, different data series and time options.
In the example below I looked at CO2 emissions per capita for selected countries:
Other data sets include the OECD Factbook, some Eurostat collections, and several US datasets. Details can be found at http://www.google.com/publicdata/directory.
How useful is Google's data explorer to the serious researcher? It all depends on whether or not the dataset you require is available - and there are a limited number - and whether or not it covers the years you need. I noticed that some of the datasets had 2005 as the latest year. Although you can embed the "visualizations" in your own web pages there are currently no download options. It is worth familiarising yourself with what has been made available here and the different "visualisation options" are attractive, but you really can't beat going direct to the original provider of the statistics. My own favourite starting point for tracking down data on a topic and/or country is still OFFSTATS - The University of Auckland Library at http://www.offstats.auckland.ac.nz/browse/
In the example below I looked at CO2 emissions per capita for selected countries:

Other data sets include the OECD Factbook, some Eurostat collections, and several US datasets. Details can be found at http://www.google.com/publicdata/directory.
How useful is Google's data explorer to the serious researcher? It all depends on whether or not the dataset you require is available - and there are a limited number - and whether or not it covers the years you need. I noticed that some of the datasets had 2005 as the latest year. Although you can embed the "visualizations" in your own web pages there are currently no download options. It is worth familiarising yourself with what has been made available here and the different "visualisation options" are attractive, but you really can't beat going direct to the original provider of the statistics. My own favourite starting point for tracking down data on a topic and/or country is still OFFSTATS - The University of Auckland Library at http://www.offstats.auckland.ac.nz/browse/
Friday, 12 March 2010
Workshop: Statistics and Market Research
If you need to track down statistics and market research via the web I am running a hands-on workshop under the UKeiG banner in Newcastle on Wednesday 21st April. The venue is the Netskills Training Suite, University of Newcastle. Further details of the workshop and a booking form are available on the UKeiG web site at http://www.ukeig.org.uk/training/2010/StatsApril.html
Friday, 11 September 2009
Google compiles industry stats for the UK - sort of
Google has launched a new page that pulls together industry stats for the UK. Google - Internet Stats, which is biased towards information on electronic and online services and products, gathers data from third party vendors many of which are priced. A list is available at the bottom of the Internet Stats page. You can, though, submit your own "killer fact". All submissions are vetted by Google.
There are five categories: Technology, Macro Economic Trends, Media Landscape, Media Consumption and Consumer Trends. Each section has further sub-categories.

This is not the answer to a market/industry researcher's prayer. The number of statistics is very limited and the search option only searches within the browsable statistics on the landing page. Do not expect to be able to search for and find data on, for example, UK chocolate consumption! If your query falls within one of the listed categories you may be in luck.
Exactly where Google is going with this and why they have introduced it is not clear. This is a UK-only initiative at present and there is no link to it from either the .com or .co.uk main Google search pages. Neither is it listed in Google Labs. Even the official announcement on "Google Barometer: New! Internet Stats all in one place" gives very little further information.
There are five categories: Technology, Macro Economic Trends, Media Landscape, Media Consumption and Consumer Trends. Each section has further sub-categories.

This is not the answer to a market/industry researcher's prayer. The number of statistics is very limited and the search option only searches within the browsable statistics on the landing page. Do not expect to be able to search for and find data on, for example, UK chocolate consumption! If your query falls within one of the listed categories you may be in luck.
Exactly where Google is going with this and why they have introduced it is not clear. This is a UK-only initiative at present and there is no link to it from either the .com or .co.uk main Google search pages. Neither is it listed in Google Labs. Even the official announcement on "Google Barometer: New! Internet Stats all in one place" gives very little further information.
Sunday, 11 January 2009
Online maps for local crime statistics
Police forces in England and Wales are now providing access to local crime statistics via online maps. These allow the public to drill down to ward level and view crime trends in their area. The statistics include information about burglary, robbery, theft, vehicle crime, violent crime and anti-social behaviour.
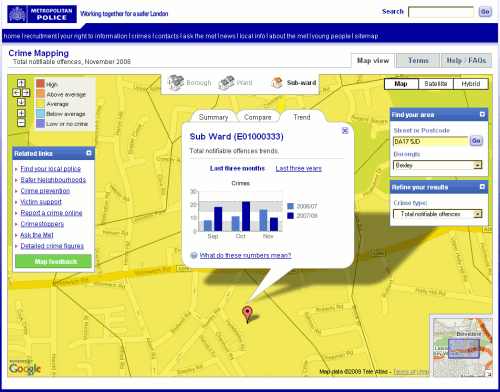
The maps should be available via the local police web sites, although you may have to hunt around for the links. Once you have found the maps, you can either browse them or enter your post code to find information on just your area. The interfaces and presentation of the data can vary considerably between police forces as does the break-down of the crime statistics. Thames Valley provides a basic map and tables of data, while others such as the Metropolitan police offer graphs as well as the figures. All of the online maps colour code areas according to the levels of crime: high, above average, average, below average, low or no crime.
Metropolitan Police crime statistics for postcode DA17 5JD

The maps should be available via the local police web sites, although you may have to hunt around for the links. Once you have found the maps, you can either browse them or enter your post code to find information on just your area. The interfaces and presentation of the data can vary considerably between police forces as does the break-down of the crime statistics. Thames Valley provides a basic map and tables of data, while others such as the Metropolitan police offer graphs as well as the figures. All of the online maps colour code areas according to the levels of crime: high, above average, average, below average, low or no crime.
Metropolitan Police crime statistics for postcode DA17 5JD
Saturday, 15 November 2008
TriMark Publications - Biotechnology, Healthcare and Life SciencesMarket Research
TriMark Publications focuses on market research in biotechnology, health care and the life sciences. You can browse reports or search by keyword. The market reports vary in price but there are detailed table of contents and the first three or four pages available free of charge as a sample. However, any figures or data on the pages are blacked out. It is refreshing, though, to see a detailed listing of what is contained in the reports before you part with significant amounts of money.
Sector Snapshots cost just USD 500 and provide a high-level overview of a particular market sector, including key players, sales data and emerging trends.

Database Tables, costing USD 100 each, are a one-page table of hard-to-find numerical information. They are derived from "a proprietary source" and provide a high-level overview of specific data points in a table format. Database Tables are not reports or comprehensive analyses.
Sector Snapshots cost just USD 500 and provide a high-level overview of a particular market sector, including key players, sales data and emerging trends.

Database Tables, costing USD 100 each, are a one-page table of hard-to-find numerical information. They are derived from "a proprietary source" and provide a high-level overview of specific data points in a table format. Database Tables are not reports or comprehensive analyses.
Sunday, 5 October 2008
Simmons & Company - energy statistics and data
Simmons & Company International is the only independent investment bank specializing in the energy industry. Founded in 1974, the firm has acted as financial advisor in over $134 billion of transactions, including 535 merger and acquisitions worth over $93 billion. As well as copies of presentations made by senior partner Matthew R Simmons there is a collection of industry statistics gathered from a variety of sources. These are split into upstream and downstream and include rig counts, summaries of oil and gas prices, US crude oil inventories, refining capacity and days of supply. There is some International data but much of it is North American biased.


Under the main Energy Industry link are lists of major public listed upstream and downstream companies (coverage is world-wide), and links to industry news sources, associations, statistics and government sites (many are North American).
Despite the geographical bias, this is a good starting point for information on the oil and gas industry as it lists most of the key resources. Matthew Simmons's presentations and papers are often quoted in the main stream media and are worth monitoring. There is an email alert for new presentations but no RSS. If you are desperate for RSS rather than email there is always the Page2RSS service that monitors pages for changes and alerts you via RSS.
Wednesday, 20 August 2008
Renewable Fuels Agency (RFA)
The Renewable Fuels Agency (RFA) (http://www.dft.gov.uk/rfa/) has been set up by the UK Government to implement the Renewable Transport Fuel Obligation (RTFO) (http://www.dft.gov.uk/rfa/aboutthertfo.cfm), which came into force on 1st April 2008. The RTFO obliges fossil fuel suppliers to ensure that by 2010 biofuels account for 5% by volume of the fuel supplied on UK forecourts. The purpose of the RTFO is to "reduce the UK's contribution to climate change and its reliance on fossil fuels". The RFA publishes updates on the progress of the RTFO. These include monthly reports on progress on achieving compliance with sustainability criteria and quarterly reports to the Department for Transport and annual reports to parliament. All reports are available on the web site.
With serious questions being raised about the impact of biofuels on food prices, farming and the environment in general, it will be interesting to see how long this all carries on. The RFA's first monthly report has just been published and covers the period 15th April - 14th May 2008. The press release contains some good summary statistics for those of us who need to get hold of such data in a hurry. There are 'associated files' (PDF and an Excel spreadsheet) that contain more detailed information.

With serious questions being raised about the impact of biofuels on food prices, farming and the environment in general, it will be interesting to see how long this all carries on. The RFA's first monthly report has just been published and covers the period 15th April - 14th May 2008. The press release contains some good summary statistics for those of us who need to get hold of such data in a hurry. There are 'associated files' (PDF and an Excel spreadsheet) that contain more detailed information.

The UK Coal Authority
The UK Coal Authority (http://www.coal.gov.uk) aims "to facilitate the proper exploitation of the Nation's coal resources, whilst providing information and addressing liabilities for which the Authority is responsible, in a professional, efficient and open manner".
If you own or are purchasing a property in a coal mining area there is a search service that will check whether or not the property might be affected by past or existing mining activity. The gazetteer (under Information Services) gives an indication of places in Great Britain that may, or may not, require a mining search to be performed. If you are thinking of moving within the UK it would be as well to check this site as well as the Environment Agency's 'In Your Backyard' (http://www.environment-agency.gov.uk/maps/), which tells you if the area is at risk of flood and whether there's a landfill site near your house.
The Coal Authority site also has reports on mining activity in the UK and statistics on production. There are links to sites that cover coal mining related topics and information on technologies. The latter includes coal gasification, cleaner coal technologies and environmental issues. These technology 'fact sheets' are a good starting point if you need to get up to speed on the industry jargon and how it all works.
If you own or are purchasing a property in a coal mining area there is a search service that will check whether or not the property might be affected by past or existing mining activity. The gazetteer (under Information Services) gives an indication of places in Great Britain that may, or may not, require a mining search to be performed. If you are thinking of moving within the UK it would be as well to check this site as well as the Environment Agency's 'In Your Backyard' (http://www.environment-agency.gov.uk/maps/), which tells you if the area is at risk of flood and whether there's a landfill site near your house.
The Coal Authority site also has reports on mining activity in the UK and statistics on production. There are links to sites that cover coal mining related topics and information on technologies. The latter includes coal gasification, cleaner coal technologies and environmental issues. These technology 'fact sheets' are a good starting point if you need to get up to speed on the industry jargon and how it all works.
Subscribe to:
Posts (Atom)